Most answers to this question are written from memory. This one is written from the Victoria Real Estate Board's September 2026 benchmark figures, so every number below can be checked against the source.
A benchmark is not a listing. It is the board's modelled price for a typical home of that type in that community, which makes it the fairest way to compare one area against another. It will never match a specific house. What it does do is tell an owner or a buyer exactly where a budget sits relative to the ordinary home in each place, and that is a more useful starting point than an impression.
One piece of context first, because it changes what every budget below is worth. In September 2026 the board recorded 3,811 active listings against 463 sales, around 6.8 months of residential supply, and described the region as having moved into buyer's market territory for the first time since January 2015 outside the start of the pandemic. Homes took 55 days to sell, five days longer than a year earlier, and sold at 97% of asking on average. More choice and more time is the backdrop for all three budgets.
The benchmark house, by community
Single family benchmark prices, September 2026, with the change over twelve months.
| Community | Benchmark house | Year over year |
|---|---|---|
| Oak Bay | $1,726,800 | down 3.0% |
| North Saanich | $1,471,800 | down 1.8% |
| Saanich East | $1,309,500 | down 1.7% |
| Victoria | $1,216,500 | down 0.4% |
| Central Saanich | $1,187,600 | down 2.0% |
| Colwood | $1,080,800 | down 0.1% |
| Langford | $1,051,100 | down 1.1% |
| Saanich West | $1,041,400 | down 4.2% |
| View Royal | $1,017,500 | down 6.1% |
| Sidney | $1,010,400 | down 0.2% |
| Esquimalt | $972,200 | down 8.1% |
| Sooke | $807,300 | down 2.7% |
| Gulf Islands | $735,800 | down 5.3% |
Source: Victoria Real Estate Board, MLS® Home Price Index, September 2026 statistics package.
Every house benchmark in the table is below where it sat a year ago. The spread is what matters though. The benchmark house in Oak Bay costs more than twice the benchmark house in Sooke, and both are inside the same board region, within an hour of each other.
What $1.5M clears
Measured against that table, $1.5M is above the benchmark house in twelve of the thirteen communities. The single exception is Oak Bay, where the benchmark sits at $1,726,800, roughly $227,000 beyond the budget.
That is the honest headline, and it reframes the question. At $1.5M the constraint is rarely the area. In Victoria, Saanich East, Central Saanich, Langford, Colwood, Saanich West, View Royal, Sidney, Esquimalt, Sooke and the Gulf Islands, the budget clears the typical house with room left. North Saanich clears by about $28,000, which in practice means the budget reaches the area but not much above its middle.
So the real decision at $1.5M is what the extra buys once the area is affordable: a larger lot, a better position, a house that needs nothing, or a property with potential the next owner can use. Those are four different purchases at the same price.
Listed now between $1.4 and $1.5 million
A benchmark is the price of a typical house rather than a real one. These are actual homes on the market in the top end of this budget, each shown beside the September benchmark for its own community so the two can be read together.
Where a home sits well above its area's benchmark, it is usually paying for something specific, the lot, the position, the outlook, or work somebody has already done. Where it sits below, that is worth asking about too.
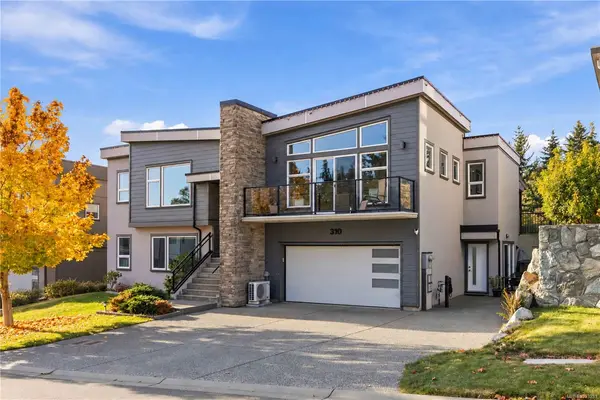
$1,449,000
310 Lone Oak Pl, Langford BC V9B 0X3, Langford
6 bed · 4.0 bath · 3,203 sq ft
Single Family Residence
Langford September 2026 single-family benchmark: $1,051,100
Courtesy of eXp Realty
MLS® Reciprocity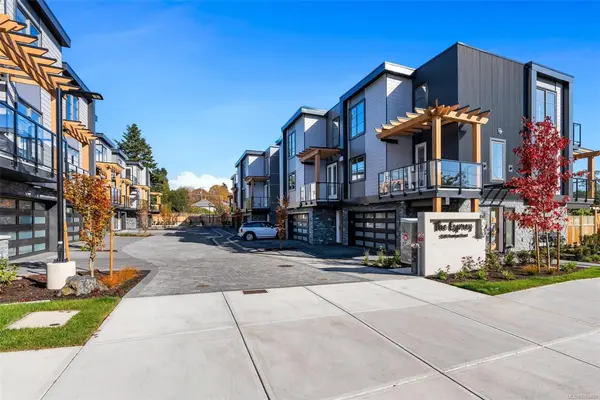
$1,499,000
#5 - 2590 Penrhyn St #5, Saanich BC V8N 1G3, Saanich
3 bed · 4.0 bath · 2,273 sq ft
Townhouse
Saanich East September 2026 single-family benchmark: $1,309,500
Courtesy of RE/MAX Camosun
MLS® Reciprocity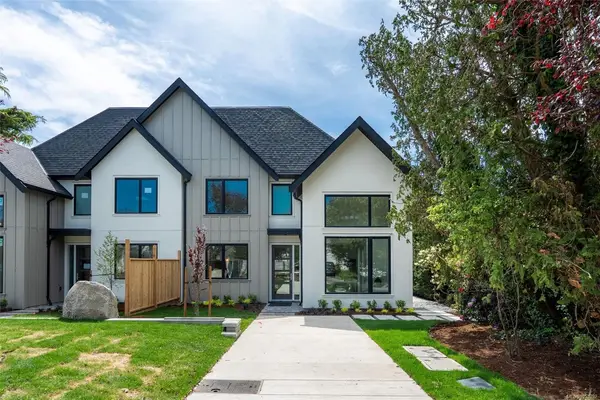
$1,499,000
#1 - 2456 Tod Rd #1, Oak Bay BC V8R 2N1, Oak Bay
3 bed · 4.0 bath · 1,355 sq ft
Townhouse
Oak Bay September 2026 single-family benchmark: $1,726,800
Courtesy of Alexandrite Real Estate Ltd.
MLS® Reciprocity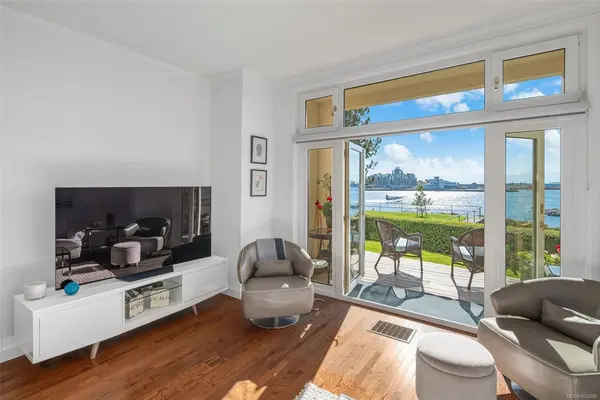
$1,499,900
#90 - 208 Russell St #90, Victoria BC V9A 3X2, Victoria
3 bed · 3.0 bath · 2,073 sq ft
Townhouse
Victoria West September 2026 single-family benchmark: $1,216,500
Courtesy of Engel & Volkers Vancouver Island
MLS® Reciprocity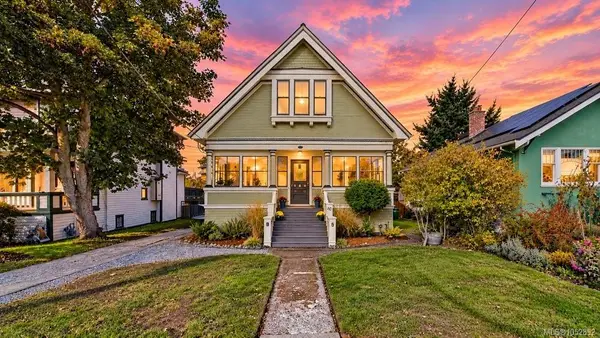
$1,488,000
40 Government St, Victoria BC V8V 2K3, Victoria
3 bed · 3.0 bath · 2,370 sq ft
Single Family Residence
Victoria September 2026 single-family benchmark: $1,216,500
Courtesy of Pemberton Holmes Ltd. - Oak Bay
MLS® Reciprocity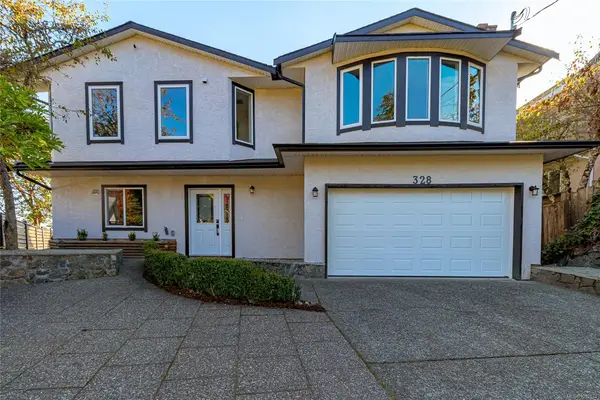
$1,425,000
328 Damon Dr, View Royal BC V9B 5J5, View Royal
5 bed · 3.0 bath · 2,727 sq ft
Single Family Residence
View Royal September 2026 single-family benchmark: $1,017,500
Courtesy of Royal LePage Coast Capital - Oak Bay
MLS® ReciprocityWhat $2M clears
At $2M the budget clears the benchmark house in all thirteen communities, Oak Bay included, by roughly $273,000.
Once a budget is above every area benchmark, geography stops narrowing the search and attributes start to. What separates two $2M properties is usually some combination of lot size and shape, outlook, proximity to water, the age and condition of the building, and whether the house has already had the expensive work done. A $2M house in Esquimalt and a $2M house in Oak Bay are not the same purchase, and neither is better on paper. One buys considerably more house and land for the money, the other buys position in the region's most expensive benchmark area.
This is also the band where the gap between asking and benchmark gets wide enough to be worth watching. In a market selling at 97% of asking over 55 days, a property priced well above its area benchmark is making a specific argument about why it deserves the premium. Sometimes the argument holds. It is worth asking what it rests on.
Listed now between $1.9 and $2 million
Every community benchmark in the table above sits below this budget, so these homes are not being chosen by what the area costs. They are being separated by what each one is.
Read each against its own September benchmark rather than against each other. A home at twice its area's benchmark and a home a little above its area's benchmark are two different propositions at nearly the same price.
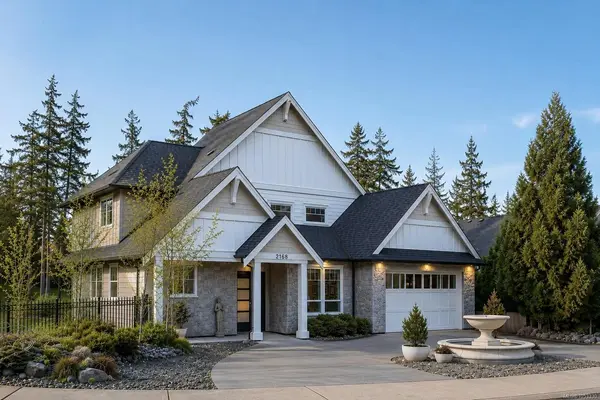
$1,998,000
2168 Champions Way, Langford BC V9B 0R9, Langford
4 bed · 4.0 bath · 3,806 sq ft
Single Family Residence
Langford September 2026 single-family benchmark: $1,051,100
Courtesy of RE/MAX Camosun
MLS® Reciprocity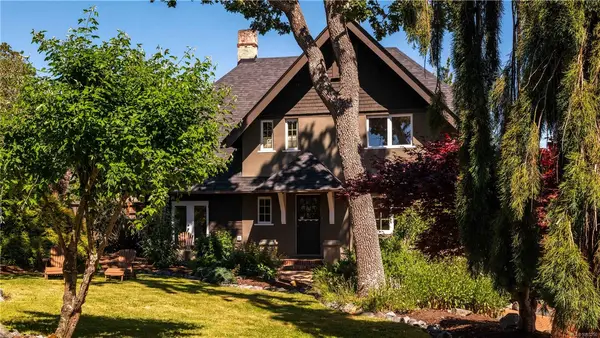
$1,999,000
1562 Richardson St, Victoria BC V8S 1R3, Victoria
4 bed · 4.0 bath · 3,639 sq ft
Single Family Residence
Victoria September 2026 single-family benchmark: $1,216,500
Courtesy of Pemberton Holmes Ltd.
MLS® Reciprocity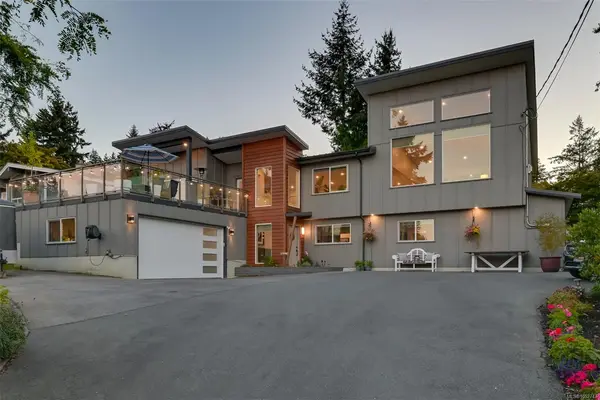
$1,999,000
8566 Moxon Terr, North Saanich BC V8L 1K6, North Saanich
5 bed · 3.0 bath · 3,378 sq ft
Single Family Residence
North Saanich September 2026 single-family benchmark: $1,471,800
Courtesy of Engel & Volkers Vancouver Island
MLS® Reciprocity
$1,999,900
3392 Haida Dr, Colwood BC V9C 3V9, Colwood
5 bed · 5.0 bath · 4,257 sq ft
Single Family Residence
Colwood September 2026 single-family benchmark: $1,080,800
Courtesy of RE/MAX Camosun
MLS® Reciprocity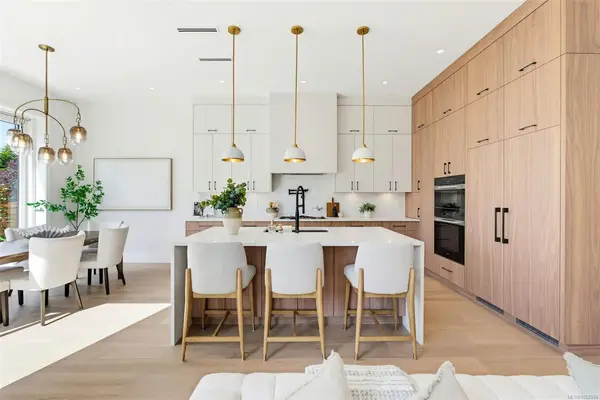
$1,999,000
#1 - 3024 Cadboro Bay Rd #1, Oak Bay BC V8R 5J9, Oak Bay
3 bed · 3.0 bath · 2,103 sq ft
Townhouse
Oak Bay September 2026 single-family benchmark: $1,726,800
Courtesy of Alexandrite Real Estate Ltd.
MLS® Reciprocity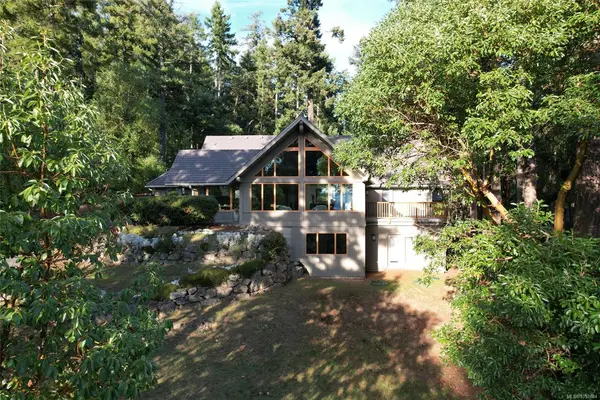
$1,965,000
154 Cormorant Cres, Salt Spring BC V8K 1G8, Salt Spring
3 bed · 3.0 bath · 4,095 sq ft
Single Family Residence
Gulf Islands September 2026 single-family benchmark: $735,800
Courtesy of Real Broker
MLS® ReciprocityWhat $3M clears
At $3M no community benchmark is a meaningful reference point. The budget clears the highest one, Oak Bay, by well over a million dollars.
Above that level the comparison set is not an area, it is a short list of specific properties, and benchmark data stops being the right tool. Waterfront, acreage, and a small number of positions in the region behave on their own terms, with their own timelines. The board's September 2026 figures show waterfront single family homes taking different times to sell than the general market, and transactions at this level often turn on features that no index captures.
The practical point for a buyer at $3M is that patience behaves differently. There are fewer comparable sales in a year, so each one carries more weight in any valuation, and the right property may simply not be listed in the month someone is ready.
Listed now between $2.8 and $3 million
At this level there are far fewer homes on the market at any given moment, so what is listed today is a thin slice rather than a representative sample. It changes a great deal month to month.
Each is shown beside the September benchmark for its community, which at this budget is less a comparison than a reminder of how far above the typical house these properties sit.
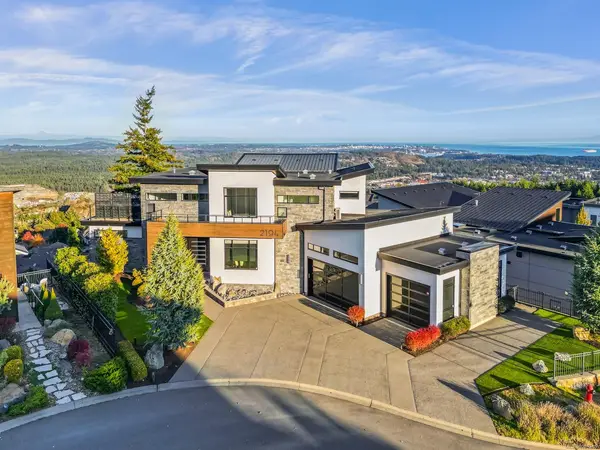
$2,850,000
2194 Navigators Rise, Langford BC V9B 0B4, Langford
5 bed · 6.0 bath · 5,716 sq ft
Single Family Residence
Langford September 2026 single-family benchmark: $1,051,100
Courtesy of eXp Realty
MLS® Reciprocity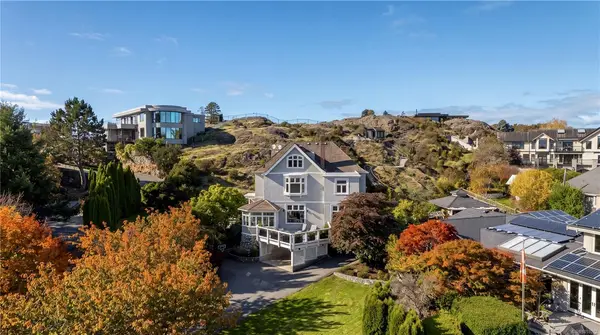
$2,899,000
454 Newport Ave, Oak Bay BC V8S 5C5, Oak Bay
4 bed · 4.0 bath · 4,543 sq ft
Single Family Residence
Oak Bay September 2026 single-family benchmark: $1,726,800
Courtesy of The Agency
MLS® Reciprocity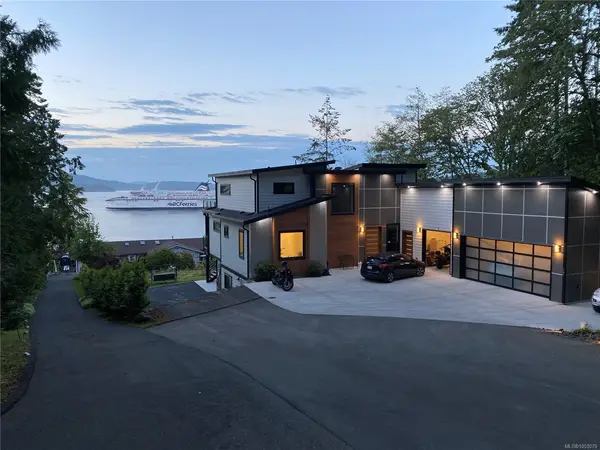
$2,899,999
1470 Lands End Rd, North Saanich BC V8L 5K1, North Saanich
7 bed · 5.0 bath · 4,854 sq ft
Single Family Residence
North Saanich September 2026 single-family benchmark: $1,471,800
Courtesy of Engel & Volkers Vancouver Island
MLS® Reciprocity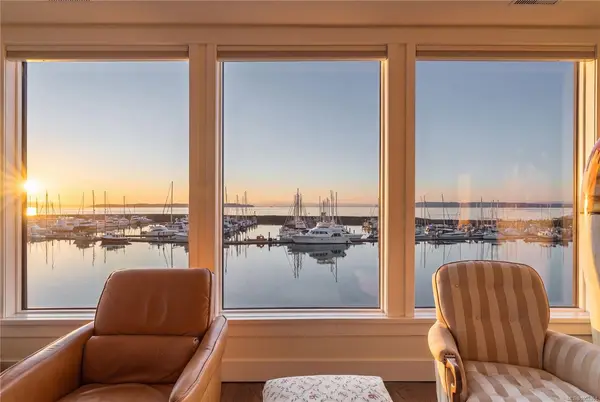
$2,800,000
#201 - 9949 Third St #201, Sidney BC V8L 3B1, Sidney
4 bed · 4.0 bath · 3,121 sq ft
Townhouse
Sidney September 2026 single-family benchmark: $1,010,400
Courtesy of Engel & Volkers Vancouver Island
MLS® Reciprocity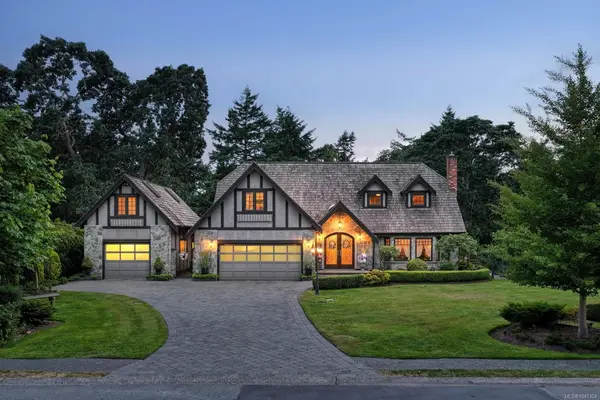
$2,895,000
2773 Arbutus Rd, Saanich BC V8N 5X8, Saanich
4 bed · 4.0 bath · 3,448 sq ft
Single Family Residence
Saanich East September 2026 single-family benchmark: $1,309,500
Courtesy of The Agency
MLS® Reciprocity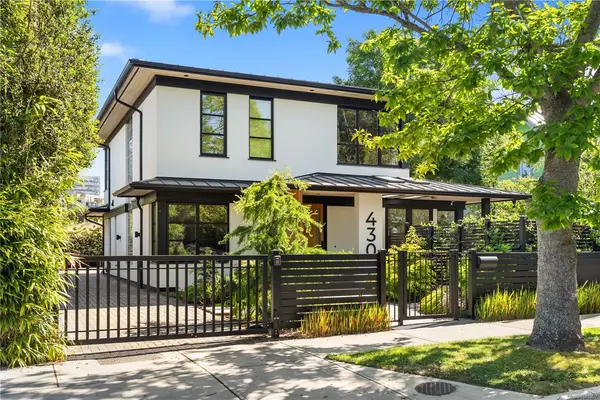
$2,988,000
430 Luxton Ave, Victoria BC V8V 1C9, Victoria
4 bed · 4.0 bath · 3,734 sq ft
Single Family Residence
Victoria September 2026 single-family benchmark: $1,216,500
Courtesy of The Agency
MLS® ReciprocityAttached homes are a different question entirely
The table above is single family. For condominiums and townhouses the same budgets mean something quite different.
In September 2026 the benchmark condominium in Victoria's core was $547,800, up 1.0% over twelve months, and the benchmark townhouse was $829,400. Across the full board region the condominium benchmark was $542,800 and the townhouse benchmark $774,000.
So all three budgets in this article sit far above the typical attached home anywhere in the region. A buyer at $1.5M looking at condominiums is shopping at roughly three times the core benchmark, which puts them in a small and specific part of that market rather than a broad one.
Worth knowing if attached is on the list: the townhouse segment is where supply has been building. Townhouse active listings in September 2026 were 457 against 328 a year earlier, a rise of around 39%, while townhouse sales fell 26.4%. More choice in that segment than in detached, where active listings were slightly below last year.
Three things that move the answer more than the area does
Condition. A house that needs a roof, windows, wiring and a furnace can be the same benchmark on paper and a materially different purchase in practice. In a market with 6.8 months of supply, buyers have the time to find out, and they use it.
The lot. Across Greater Victoria the benchmark house in the core is worth about $25,800 less than it was in October 2023, a fall of roughly 2% over nearly three years. What has changed over that period is what lots are permitted to hold under provincial small scale multi unit housing legislation. Whether any individual lot can support additional units depends on its size, servicing, setbacks, slope and the local tree bylaw, and only a municipal pre application process confirms it. But it is a question worth asking before deciding what a property is worth, and it is one most listings do not answer.
Timing. Inventory in this region generally thins through the winter. A budget that has good choice in October may have less in January, which cuts both ways depending on whether someone is buying or selling. The current market report can help readers check the latest published figures.
How to use these numbers properly
Three cautions, because a figure used carelessly is worse than no figure.
Community benchmarks are built on small monthly samples in the smaller areas. September 2026 recorded four single family sales in Sidney, seven in View Royal and ten in Esquimalt. Those benchmarks move sharply month to month and should be read as direction rather than precision.
A benchmark is a modelled typical home, not a price for any particular property. Two houses on the same street can sit well either side of it.
And these are September 2026 figures. The board publishes monthly, and this market has moved enough in the past year that a figure three or four months old can mislead. Anyone relying on these numbers for a decision should check the current month.
Frequently asked questions
Is $1.5M enough to buy in Oak Bay?
Not at the typical house. Oak Bay's single family benchmark was $1,726,800 in September 2026, around $227,000 above that budget. Smaller homes, attached homes and properties needing work can sit below the benchmark, so it is not impossible, but it is below the middle of that market.
Which area gives the most house for the money?
On September 2026 benchmarks, Sooke at $807,300 and the Gulf Islands at $735,800 carry the lowest single family benchmarks in the region. Inside the core, Esquimalt at $972,200 and Saanich West at $1,041,400 are the lowest. Each of those involves real trade offs in commute, servicing and amenities, which is why the benchmark alone should not decide anything.
Are prices falling in Greater Victoria?
Every community single family benchmark in the table above was below its level twelve months earlier, and the core house benchmark fell 2.0% over the year. The board noted that one month of buyer's market conditions does not establish a trend. These are figures for a single month, published monthly, and the current month is the one that matters.
Does a lower benchmark mean it is a better time to buy?
It means there is more choice and more time. With around 6.8 months of supply and homes selling at 97% of asking over 55 days, buyers have more room to investigate a property than they did a year ago. Whether that suits any particular person depends on their own timing, financing and what they are trying to achieve.
Why use benchmark prices instead of averages?
An average moves when the mix of what sold changes. A quiet month with a few high end sales pulls the average up without any individual home becoming more valuable. The benchmark models a consistent typical home, which makes comparing one community against another, or this month against last, considerably more reliable.
Sources
- Victoria Real Estate Board, September 2026 statistics package and market report, released 1 October 2026. Benchmark prices by community and property type, monthly sales summary, active listings, days to sell and sale to list ratio. Victoria Real Estate Board current statistics
- Victoria Real Estate Board, MLS® Home Price Index, October 2023 and September 2026, for the Victoria Core single family comparison.
Figures in this article are for September 2026 and are reviewed each month when the board publishes.
For a property specific starting point, see the home value page.